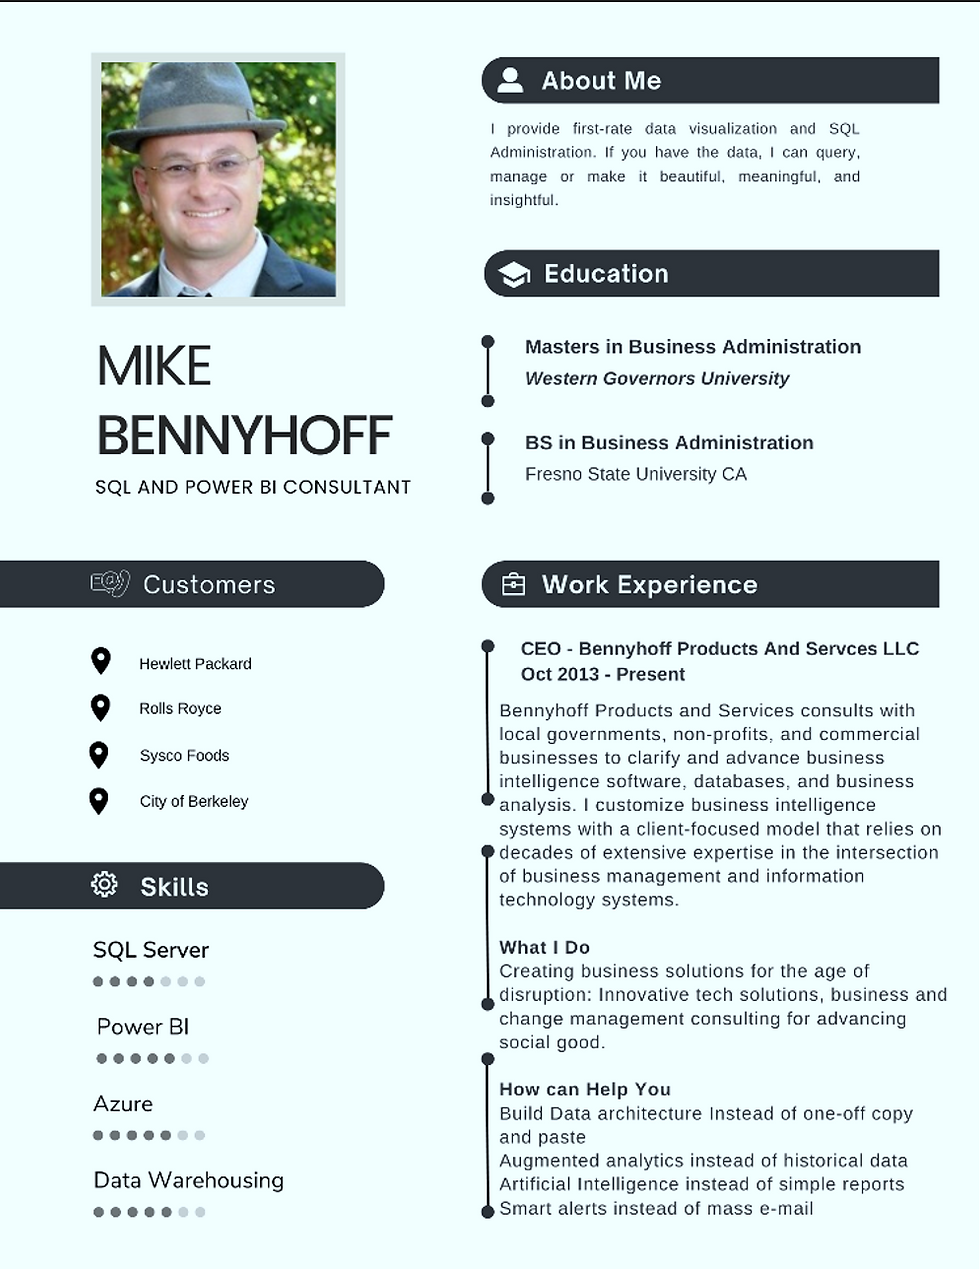
In today's fast-paced business environment, decision-making is critical. To make informed and actionable decisions, you need the right tools. This is where Power BI comes in. Power BI is a cloud-based business intelligence solution from Microsoft that helps you turn data into insights. It is a powerful tool for data analysis that allows you to connect, transform, and visualize data in a way that makes sense. In this blog post, we'll walk you through the basic steps you need to take to get started with Power BI and working with Bennyhoff Products And Services (Mike Bennyhoff).
Are You Frustrated By:
• Skill Shortage - Lack Of gravitas or experience of consultants
• High Turnover - On outsourcing platforms here today, gone tomorrow
• Poor Communication - Missed deadlines, not sure about the next steps
Mike B - Experience. Results. Efficiency!

What Others Are Say About My Project Management Systems
"Mike is PROFICIENT in what he does and will go the extra mile to provide you with solutions and guidance. A++"
"Great communicator! Will definitely work with him again."
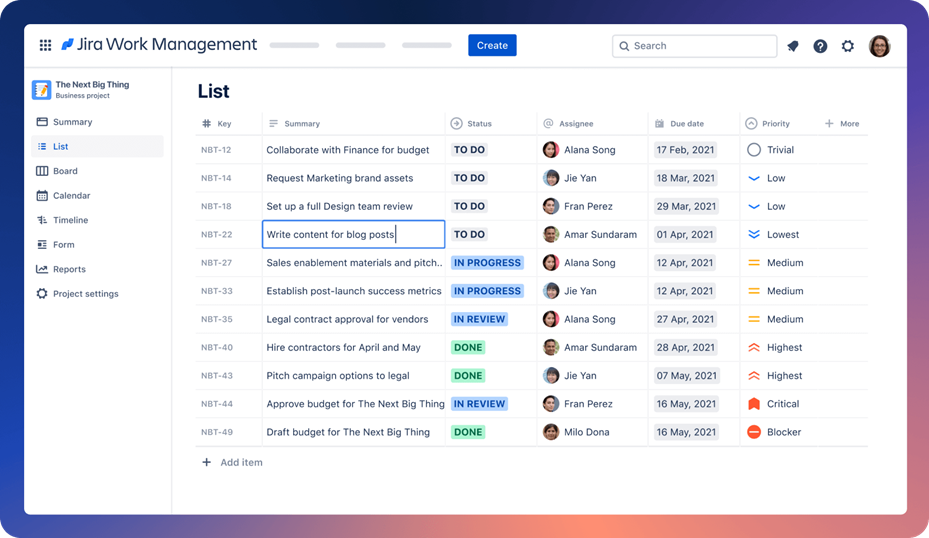
My Process: To communicate project stats and billing, I use a tool called Jira.This tool is provided at no cost to you and will send an update each time I log hours, close a task or ask you to diver information.

Each time we meet I can move a card from "In Progress" to "Done"

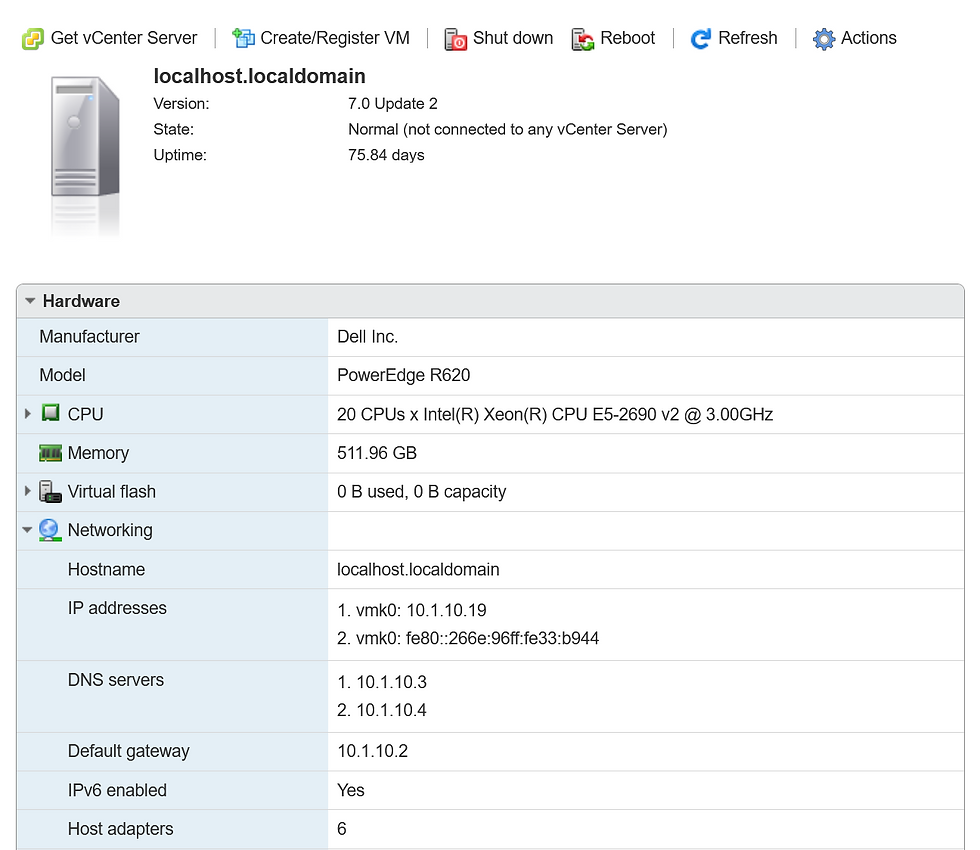
Once we have the project parameters and communication setup, I setup a VM (Virtual Machine) for your environment this way there is NO cross pollination of your data and others customers data. I have a server with 20, 512 GB of ram and 25 TB of storage no other consultant offers anything that comes close to this level of service.

Power BI:
Step 1: Get the Right Licenses
The first step in getting started with Power BI is ensuring you have the right licenses. You must sign up for a Power BI account using your corporate email address; nope, a google e-mail address will not work! Depending on the size of your organization, there may be multiple ways to purchase the different types of Power BI products are available, including Power BI Free, Power BI Pro, and Power BI Premium. There are specific features and limitations of each license type. -- I suggest starting with my blog on Power BI Licensing

Alliteratively, Have Me Review And Consult On What Is Best For Your Organization. We can have a 1-hour conversation, and I can describe the best license to get you started without pointless spending and unnecessary services.
Step 2: Connect Your Data Sources
Once you have the right licenses, the next step is to connect your data sources to Power BI. Power BI can connect to a wide range of data sources, including Excel spreadsheets, SQL Server databases, SharePoint lists, Salesforce, and many others. The easiest way to connect your data sources is to use the Power BI Desktop application. This application allows you to connect to your data sources and create data models that can be used to analyze your data.

Look daunting, have BPS connect Power BI to API's and other complex systems like Salesforce and Google Analytics; here is a list of the products with which I have connected Power BI.
Salesforce - https://www.salesforce.com/
Google Analytics - https://marketingplatform.google.com/about/analytics/
Viewpoint Construction - https://www.viewpoint.com/
Microsoft Dynamics 365 - https://dynamics.microsoft.com/en-us/
NetSuite - https://www.netsuite.com/portal/home.shtml
Sage - https://www.sage.com/en-us/
Step 3: Create Reports and Visualizations
With your data sources connected, you can start creating reports and visualizations. Power BI makes it easy to create reports by providing a drag-and-drop interface that allows you to add visualizations to your report canvas. These visualizations can be customized to suit your needs and can include charts, tables, maps, and many others. You can also add filters, slicers, and drill-down capabilities to your reports to allow for greater interactivity.

Once more I provide full service consultation and consulting, if you have the data I can wrangle it and transform it and make it useful.
Step 4: Share Your Reports and Dashboards
Once you've created your reports and visualizations, you can share them with others in your organization. Power BI allows you to share your reports and dashboards with individuals, groups, or the entire organization. You can also set up automatic data refresh to ensure that your reports are always up-to-date.
Step 5: Plan for Growth
As your organization grows, so will your data needs. It's essential to create a plan for how you will scale your Power BI implementation. This may include upgrading your licenses to support more users, investing in more powerful hardware, or developing a governance plan to ensure that data is managed and maintained properly.
Conclusion:
Business intelligence is critical for decision-making in today’s fast-paced business environment. With Power BI, you have a powerful tool that can help you turn data into insights. Getting started with Power BI is easy, but it's important to take the right steps to ensure that you set yourself up for success. By following the steps outlined in this guide, you'll be well on your way to creating powerful reports and visualizations that can help you make informed and actionable decisions.
So, what are you waiting for, connect with me today to get stared! Power up your business intelligence with Power BI today!
Mike Bennyhoff - 916-303-3627 - Mike@BPS-Corp.com

Comments